
How Quinn Hughes’ dominant puck-moving stats compare to his teammates
By Harman Dayal, Apr 17, 2020, The Athletic
His first NHL shift is all Quinn Hughes needed to show that he’s a breed of defencemen that the Canucks hadn’t seen in at least a decade.
More specifically, all he needed was his first breakout.
As a loose puck emerged behind the net, Hughes established inside position and spun off a much heavier Kings forechecker to gain possession – pressure still behind him and a second forechecker looking to pounce from the opposite side.
Under heavy duress and with his defence partner Luke Schenn nearby ready to accept a pass, Hughes had the simple option available– the easy D to D option that 95 percent of defencemen in his skates, let alone a rookie in his first shift, would choose.
But Hughes isn’t like 95 percent of defencemen. He’s wired differently.
The young American prodigy looked off Schenn and sent a backhand saucer over the stick of the second LA forechecker and right onto the tape of Adam Gaudette on the wing in a pass that exuded tremendous confidence and composure.
In that play, the decision to send a saucer pass to the half-wall instead of a simple dish to his partner meant the difference between a breakout with possession that the Canucks actually manufactured versus the dump-out Schenn would have probably had to resort to had he received the puck.
Subtle plays like that add up over time and make a meaningful impact in pushing the possession and territorial needle in the right direction. And when you see data that shows Hughes stands in a league of his own among Canucks’ defencemen at engineering clean breakouts, it reaffirms that his mindset consistently prioritizes the best exit option over the most obvious one.
| PLAYER | POSSESSION EXIT % | POSSESSION EXITS PER 60 MINUTES |
|---|---|---|
|
48.1%
|
16.8
|
|
|
35.0%
|
10.4
|
|
|
34.6%
|
8.7
|
|
|
30.5%
|
7.1
|
|
|
30.2%
|
8.1
|
|
|
25.8%
|
7.2
|
 Quinn Hughes
 Christopher Tanev
 Troy Stecher
 Tyler Myers
 Jordie Benn
 Alexander Edler
Between the games that myself and Corey Sznajder have tracked this season, we’ve got 20 games worth of zone exit data from 2019-20. This obviously won’t tell us the complete story of the season but considering that research has shown it only takes 15-20 games for a sample size to stabilize, it will hold meaningful value in analysis.
Right away, you’ll notice that Hughes jumps out in that nearly 50 percent of his exit attempts result in a clean breakout. It’s also volume and not just the efficiency department where Hughes shines as he also doubled all but two of his teammates in generating nearly 17 possession exits per 60 minutes. Both figures are among the best marks in the NHL, and we can fairly comfortably conclude that at 20-years-old, Hughes is already one of the game’s elite puck movers.
This much shouldn’t come as a surprise, but perhaps what’s most impressive is how little risk Hughes has taken on while so incisively pushing play up the ice. Many of the game’s top puck movers are criticized at one point or another (think of Erik Karlsson or Jake Gardiner) for the number of pucks they turn over, but in Hughes’ case, his failed exit rate (turnovers plus icings) is actually cream of the crop on the Canucks.
| PLAYER | FAILED EXIT % |
|---|---|
|
20.6%
|
|
|
21.7%
|
|
|
21.9%
|
|
|
22.1%
|
|
|
22.1%
|
|
|
26.4%
|
OK, so we know where Hughes stands, but how about the rest of the Canucks’ blue line? How well do they hold up?
To examine that, we can not only key in on data from this season but years previous as well.
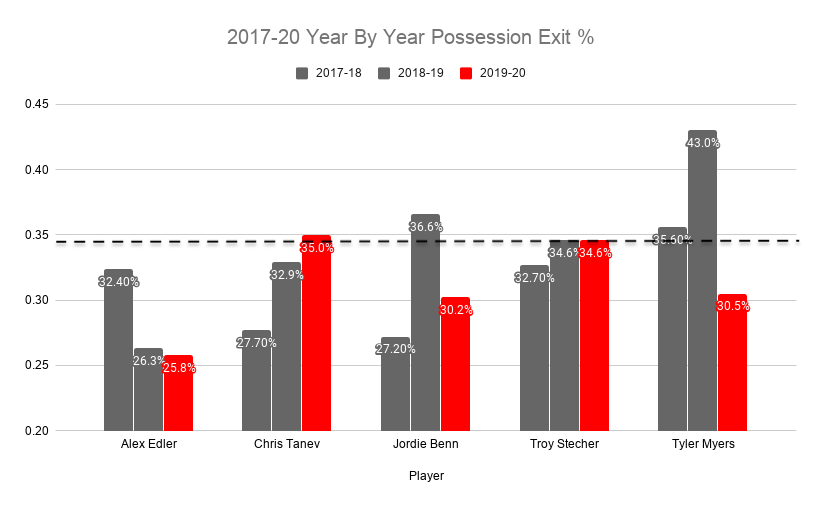
Black dotted line represents league average, red bar represents 2019-20
Alex Edler has consistently underperformed the league average possession exit rate of 34.6 percent. His transition game fell off quite significantly last year and continued to wane this season. The notable thing about Edler’s results, however, is that while he doesn’t move the puck well at this stage in his career, he’s rarely turning it over. He prefers the safe option with his breakouts and needs a partner who can handle the bulk of the transportation load.
Chris Tanev and Troy Stecher were both roughly league average in terms of moving the puck this year. The latter’s numbers have been by far the most predictable and stable of the bunch – he’s cemented himself as an average transporter. Tanev’s numbers improved a lot this season – the biggest difference is that he cut his turnovers by a drastic margin in going from a 27.3 percent fail rate down to a solid 21.7 percent.
I’m inclined to believe, however, that playing alongside Hughes might have been a major driving force behind those results. Just like playing alongside elite teammates might prop up a player’s point totals or possession numbers, one would have to think that partnering with one of the NHL’s best puck movers makes life much easier on breakouts. A partner like Hughes can hang on to the puck for a split second longer than most backs to draw forecheckers and create space for his teammates – something Tanev would unquestionably benefit from.
If Tanev benefitted to some degree from playing alongside Hughes, then Myers is on the opposite end of the spectrum in that his numbers may have been tainted by spending most of his minutes with Edler and Oscar Fantenberg – two defencemen that grade among the NHL’s bottom tier of blueliners in transition. Still, I don’t think partner quality is enough to justify Myers’ underwhelming possession exit numbers. Puck moving was one of Myers’ biggest strengths in Winnipeg and that didn’t translate to Vancouver in this dataset.
It’s possible that a bigger sample of games would have revealed better numbers because his shot and scoring chance metrics show that he did a good overall job of driving play (it’s hard to see how he would have accomplished that if he was subpar defensively and at moving the puck). In either case, I’ll be keeping a close eye on Myers’ zone exit numbers moving forward.
Viewed in totality, the Canucks’ defence corps is pretty pedestrian after Hughes with respect to breaking the puck out, but some of the biggest gains they made this season come because of who they lost.
| PLAYER | POSSESSION EXIT % | FAILED EXIT % |
|---|---|---|
|
34.6%
|
22.4%
|
|
|
32.9%
|
27.3%
|
|
|
30.3%
|
22.7%
|
|
|
26.3%
|
22.0%
|
|
|
24.9%
|
35.5%
|
|
|
17.8%
|
34.1%
|
 Ben Hutton
 Derrick Pouliot
 Erik Gudbranson
Erik Gudbranson was predictably a tire fire with the puck in his own zone, but Derrick Pouliot was almost equally destructive. Both defencemen turned possession over or iced the puck on more than a third of their breakout attempts and did very little to advance play up the ice.
What about the forwards?
As I broke down last week, the Canucks were one of the league’s most improved team on zone exits. The majority of that is because of Hughes’ addition coupled with the departure of some of the blue line’s biggest liabilities, but forwards play a pivotal role in successful breakouts as well.
| PLAYER | POSSESSION EXIT % | FAILED EXIT % |
|---|---|---|
|
62.3%
|
19.7%
|
|
|
54.2%
|
11.9%
|
|
|
51.3%
|
20.5%
|
|
|
50.0%
|
23.1%
|
|
|
49.0%
|
11.8%
|
|
|
44.6%
|
18.1%
|
|
|
42.5%
|
17.2%
|
|
|
38.7%
|
14.5%
|
|
|
35.7%
|
14.3%
|
 Elias Pettersson
 Brock Boeser
 J.T. Miller
 Adam Gaudette
 Josh Leivo
 Jake Virtanen
 Tanner Pearson
 Bo Horvat
 Loui Eriksson
If you’re looking for an explanation as to why the Lotto line was so dominant in possessing the puck and spending their shifts in the offensive zone, look no further than how effectively they worked as a five-man unit to break the puck out. Elias Pettersson leads the way with an elite 62.3 percent possession exit clip, but Brock Boeser and J.T. Miller have been almost equally crucial. Boeser, in particular, has taken a big stride forward in this area compared to last year where his clean breakout rate was only around 45 percent with a failed rate almost double what it was this season. This is a prime example illustrating one of the many parts of his game that Boeser has rounded out.
Miller doesn’t stand out with his hands or speed, but it’s been a genuine breath of fresh air to see how smart he is at assessing pressure and then resetting the breakout when necessary. He never panics with the puck and is willing to hang on for a second longer to make the play that ensures his line keeps the puck.
On the other side, an interesting stylistic trend is how safe the second-line opted to go with their exits. You’ll note that Tanner Pearson and Bo Horvat both infrequently moved the puck up ice with possession. They’ve been much more prolific with this in years past and the really low failed exit rate suggests that this was more an intentional strategy to ensure they got the puck out at all costs against top competition – even if they didn’t get to keep it themselves.
All things considered, the Canucks have taken a big step compared to years prior when getting the puck out of their end was a nightmare. They’ve still got runway to improve, but with at least one elite puck mover on their backend and the integration of more skill up front, they’re certainly trending in the right direction.
(Photo: Jeff Vinnick / NHLI via Getty Images)